empty
30.04.2025 03:29 AM
Trading Recommendations and Analysis for EUR/USD on April 30: The Market Remains in a State of Hibernation

EUR/USD 5-Minute Analysis

This image is no longer relevant

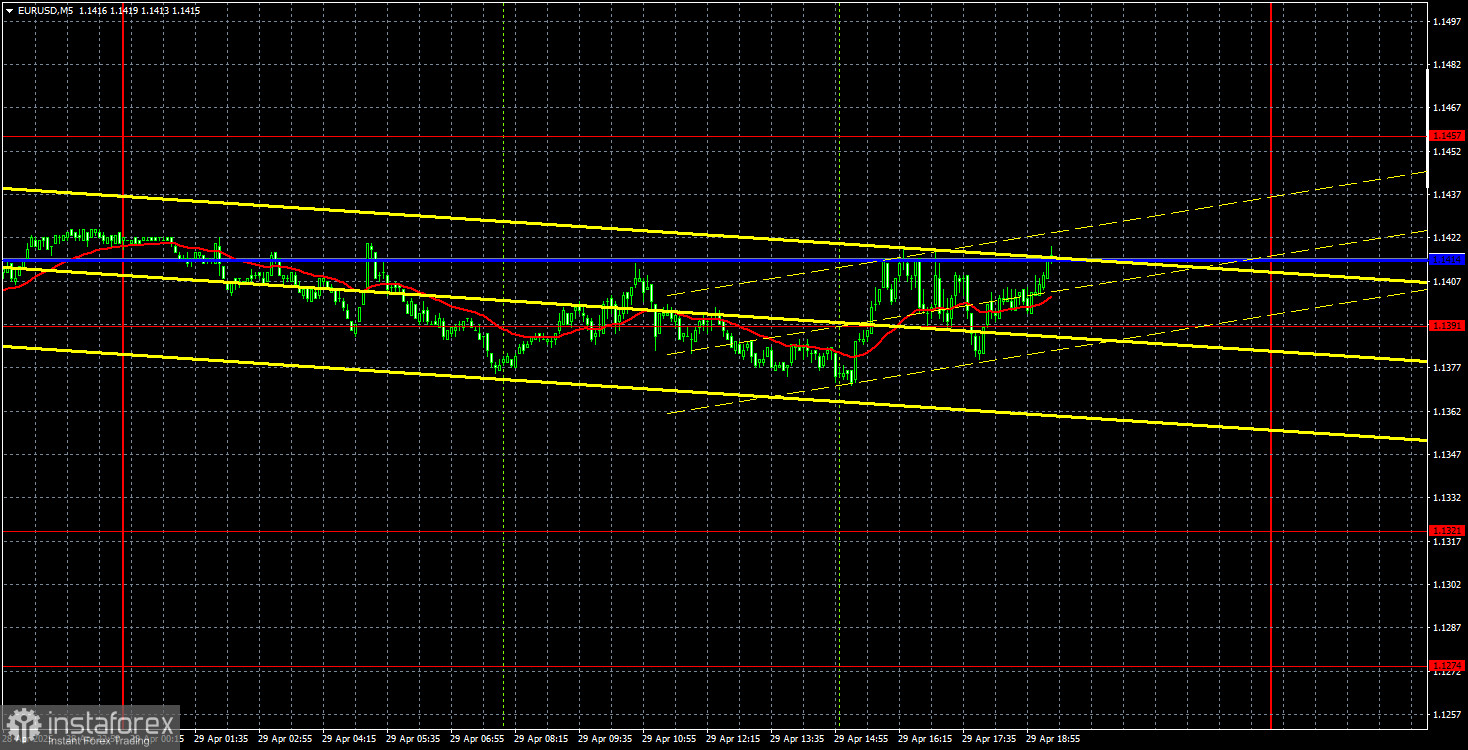
The EUR/USD currency pair continued to trade within a sideways channel throughout Tuesday. The flat movement is visible in the chart above. Last week, the pair briefly broke out of the range, only to quickly return to it. That was when Trump was "firing and reinstating Powell" — of course, that's sarcasm. In reality, Trump had considered firing Powell, then changed his mind. These headlines initially triggered a dollar sell-off, followed by a rebound, although they held no real value for the market.

As for Tuesday, the only somewhat noteworthy report — the JOLTS job openings — failed to elicit any reaction from traders, as we had warned. The market now reacts either to Trump's news related to the trade war or the Federal Reserve and monetary policy — or it prefers not to trade. As a result, there was practically nothing to analyze on Tuesday. Trump made no significant new statements, the macroeconomic backdrop was predictably ignored, and the technical picture remained unchanged.

On the 5-minute timeframe, the pair ignored the 1.1391 level all day, which was eventually removed from the charts. The price bounced off the critical line several times, but in none of those attempts did it drop more than 30 pips. Volatility was low, and the pair remained within the sideways range — a telling sign.

COT Report

This image is no longer relevant

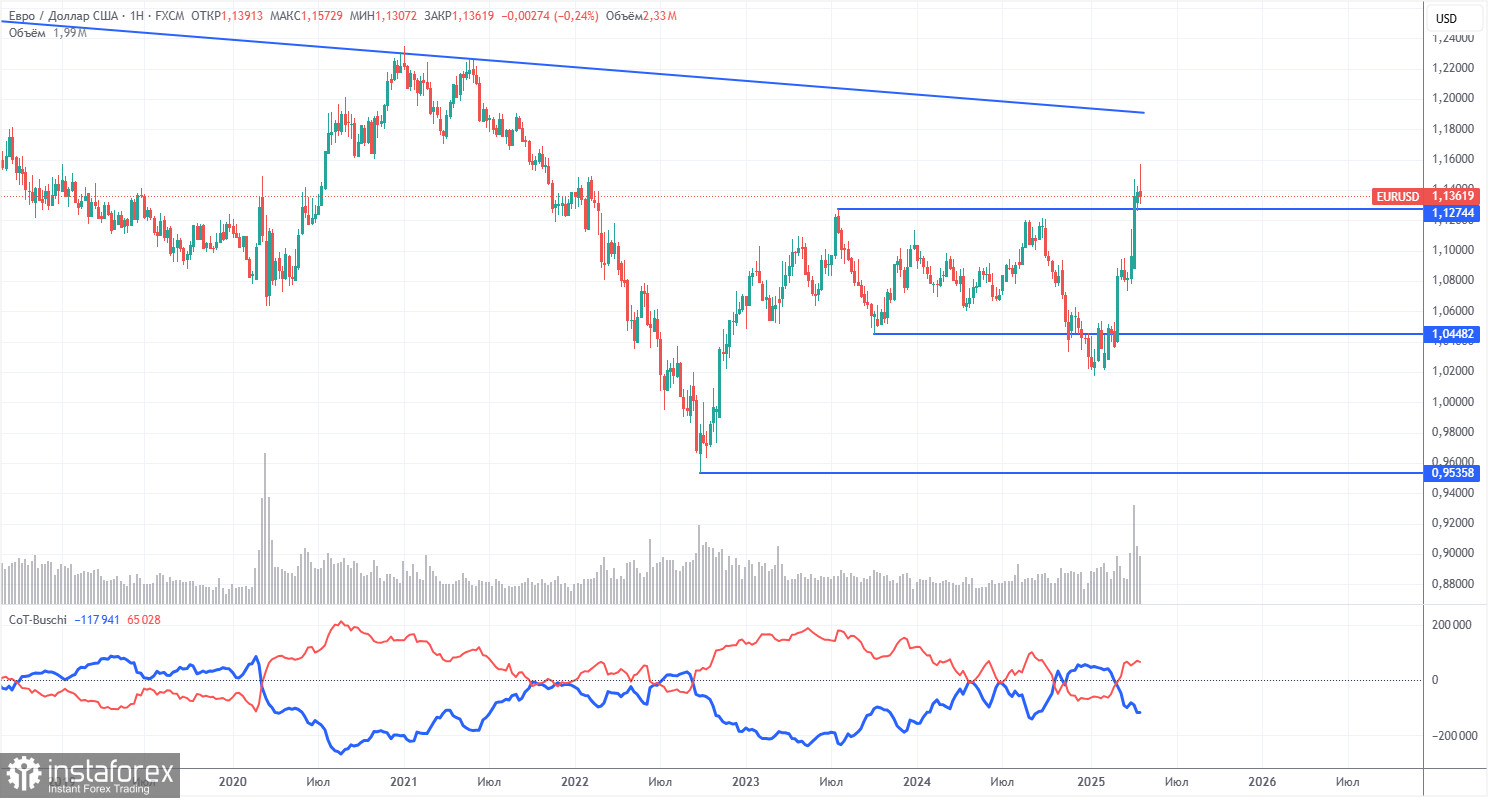
As shown in the chart above, the net position of non-commercial traders remained bullish for a long time. The bears barely managed to move into dominance but quickly lost it. Since Trump took office as U.S. President, the dollar has fallen into an abyss.

We cannot definitively say that the decline of the American currency will continue, and the COT reports reflect the true sentiment of major players, which can also change very quickly in the current circumstances.

We still do not see any fundamental factors for strengthening the European currency, but one very significant factor remains for the fall of the U.S. dollar. The pair may correct for a few more weeks or months, but a 16-year downtrend won't be reversed so quickly.

The red and blue lines have crossed again, so the trend in the market is now bullish once more. Over the last reporting week, the number of longs from the "Non-commercial" group decreased by 900, and the number of shorts increased by 3,300. Accordingly, the net position decreased by 4,200 contracts.

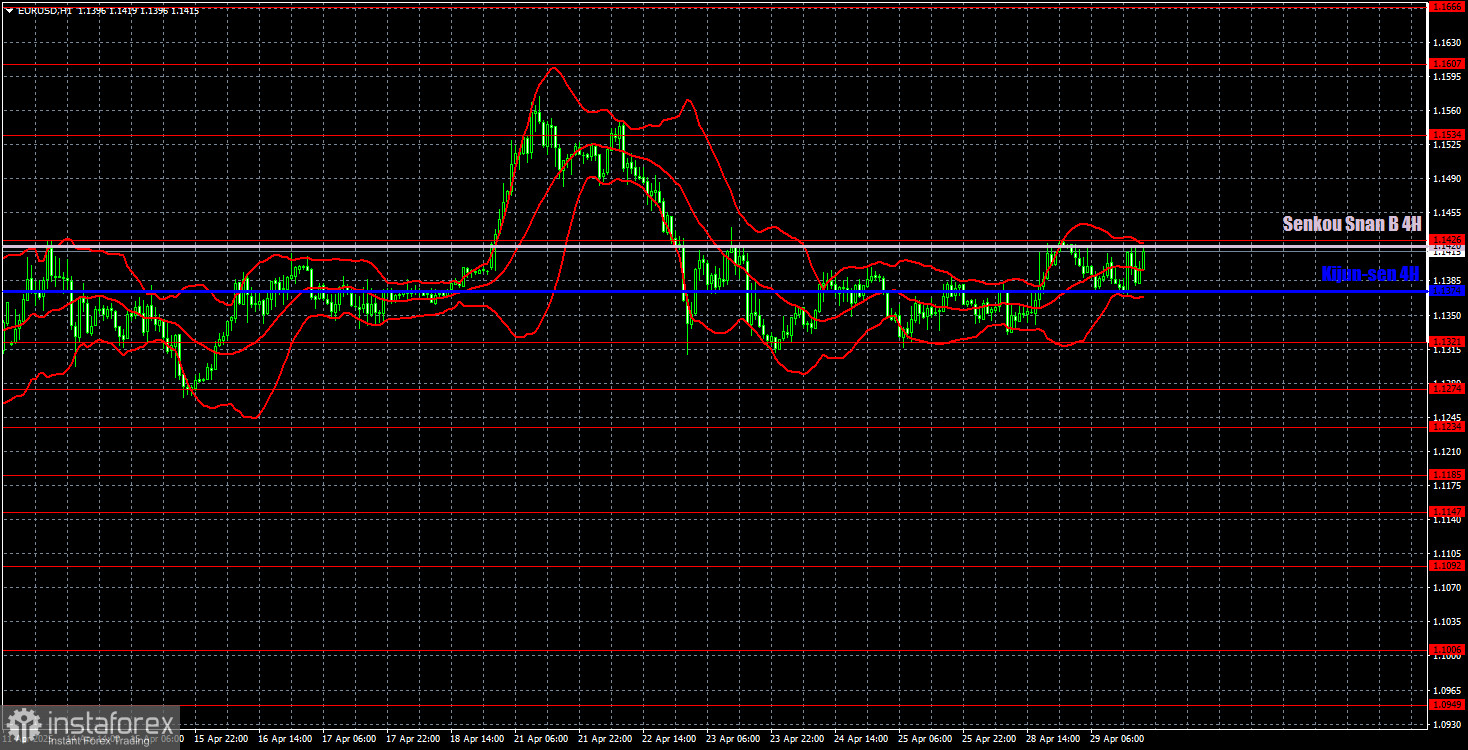
EUR/USD 1-Hour Analysis

This image is no longer relevant

On the hourly timeframe, EUR/USD maintains a bullish bias but has been flat for several weeks due to a lack of news regarding Trump's trade conflicts. On the daily timeframe, we can officially declare that the downtrend has been canceled — something that would never have happened if Trump hadn't started a trade war with the rest of the world. In this case, the fundamental backdrop disrupted the technical picture — a rare but not impossible event. There is currently very little logic or technical consistency in price movements across timeframes, and the macroeconomic backdrop has no meaningful influence on the pair.

For April 30, we highlight the following trading levels: 1.0823, 1.0886, 1.0949, 1.1006, 1.1092, 1.1147, 1.1185, 1.1234, 1.1274, 1.1321, 1.1426, 1.1534, 1.1607, 1.1666, as well as the Senkou Span B line (1.1420) and the Kijun-sen line (1.1374). Ichimoku indicator lines may shift throughout the day, so this should be considered when identifying trade signals. Don't forget to place your Stop Loss at breakeven once the price moves 15 pips in your favor. This will protect against potential losses if the signal turns out to be false.

On Wednesday, significant important data is scheduled for release in the Eurozone. In particular, we expect Germany's Retail Sales, Unemployment, GDP, Eurozone GDP, and Germany's inflation data. In the U.S., we expect reports on GDP, ADP employment, and the Core PCE Price Index. However, despite this abundance of macroeconomic data, we strongly doubt that traders will pay much attention to it.

Illustration Explanations:

  • Support and resistance price levels – thick red lines where movement may end. They are not trading signal sources.
  • Kijun-sen and Senkou Span B lines—These are strong Ichimoku indicator lines transferred to the hourly timeframe from the 4-hour one.
  • Extremum levels – thin red lines where the price has previously rebounded. These act as trading signal sources.
  • Yellow lines – trend lines, trend channels, and other technical patterns.
  • COT Indicator 1 on the charts – the size of the net position for each category of traders.
Paolo Greco,
Especialista em análise na InstaForex
© 2007-2025
Selecionar intervalo de tempo
5
min
15
min
30
min
1
hora
4
horas
1
dia
1
s.
Ganhe com as variações das taxas das criptomoedas com a InstaForex.
Baixe o MetaTrader 4 e abra a sua primeira operação.
  • Grand Choice
    Contest by
    InstaForex
    InstaForex always strives to help you
    fulfill your biggest dreams.
    PARTICIPE DO CONCURSO

Recommended Stories

Como negociar o par EUR/USD em 19 de maio? Dicas simples e análise de negociação para iniciantes

Análise das negociações de sexta-feira Gráfico 1H do EUR/USD Na sexta-feira, o par EUR/USD registrou uma queda significativa, apesar da ausência de fatores macroeconômicos ou fundamentais claros. Ainda assim

Paolo Greco 17:02 2025-05-19 UTC+2

Ideia de negociação para a queda do EUR/USD

Após o forte momentum de baixa de sexta-feira, o instrumento entrou em uma correção de alta e, no momento, está testando a zona de ruptura curta, a partir da qual

Andrey Shevchenko 17:32 2025-05-05 UTC+2

Ideia de negociação para a queda do GBP/USD

Após o forte movimento de baixa de curto prazo observado na sexta-feira, o par entrou em uma correção de alta e, neste momento, está testando uma zona de ruptura

Andrey Shevchenko 16:01 2025-05-05 UTC+2

EUR/USD: Plano de Negociação para a Sessão dos E.U.A. de 30 de abril (Revisão das Negociações da Manhã)

Na minha previsão matinal, destaquei o nível 1,1378 e planejei basear as decisões de entrada no mercado nele. Vamos dar uma olhada no gráfico de 5 minutos e analisar

Miroslaw Bawulski 14:52 2025-04-30 UTC+2

EUR/USD: Plano de Negociação para a Sessão dos E.U. de 24 de abril (Revisão das Negociações da Manhã)

Na minha previsão matinal, concentrei-me no nível 1,1358 e planejei tomar decisões de negociação com base nele. Vamos dar uma olhada no gráfico de 5 minutos para entender

Miroslaw Bawulski 21:48 2025-04-24 UTC+2

Como negociar o par EUR/USD em 22 de abril? Dicas simples e análise de negociação para iniciantes

Análise das operações de segunda-feira Gráfico 1H do EUR/USD O par EUR/USD iniciou a segunda-feira com uma forte recuperação. Durante a madrugada, o euro avançou entre 100 e 120 pips

Paolo Greco 15:10 2025-04-22 UTC+2

Como negociar o par GBP/USD em 11 de abril? Dicas simples e análise de negociação para iniciantes

Análise das operações de quinta-feira Gráfico 1H do GBP/USD Nas últimas 24 horas, o par GBP/USD avançou 170 pips, e a valorização da libra esterlina continuou durante a madrugada desta

Paolo Greco 16:46 2025-04-11 UTC+2

Como negociar o par GBP/USD em 7 de abril? Dicas simples e análise de negociação para iniciantes

Análise das operações de sexta-feira Gráfico 1H do GBP/USD O par GBP/USD registrou uma forte correção na sexta-feira, um movimento difícil de justificar — mesmo com a vantagem da retrospectiva

Paolo Greco 16:28 2025-04-07 UTC+2

Como negociar o par EUR/USD em 7 de abril? Dicas simples e análise de negociação para iniciantes

Análise das operações de sexta-feira Gráfico 1H de EUR/USD O par EUR/USD permaneceu sob forte instabilidade nesta sexta-feira. Desta vez, o movimento de baixa predominou — mas isso não tornou

Paolo Greco 15:51 2025-04-07 UTC+2

EUR/USD: Plano de Negociação para a Sessão dos E.U.A de 4 de Abril (Revisão das Negociações da Manhã)

Na minha previsão matinal, destaquei o nível 1,0994 e planejei basear minhas decisões de entrada no mercado nele. Vamos dar uma olhada no gráfico de 5 minutos e analisar

Miroslaw Bawulski 19:56 2025-04-04 UTC+2
Não pode falar agora?
Faça sua pergunta no chat.
Widget callback
 

Dear visitor,

Your IP address shows that you are currently located in the USA. If you are a resident of the United States, you are prohibited from using the services of InstaFintech Group including online trading, online transfers, deposit/withdrawal of funds, etc.

If you think you are seeing this message by mistake and your location is not the US, kindly proceed to the website. Otherwise, you must leave the website in order to comply with government restrictions.

Why does your IP address show your location as the USA?

  • - you are using a VPN provided by a hosting company based in the United States;
  • - your IP does not have proper WHOIS records;
  • - an error occurred in the WHOIS geolocation database.

Please confirm whether you are a US resident or not by clicking the relevant button below. If you choose the wrong option, being a US resident, you will not be able to open an account with InstaForex anyway.

We are sorry for any inconvenience caused by this message.