empty
11.12.2023 01:25 PM
GBP/USD: trading plan for the US session on December 11th (analysis of morning deals). The pound attempts to recover

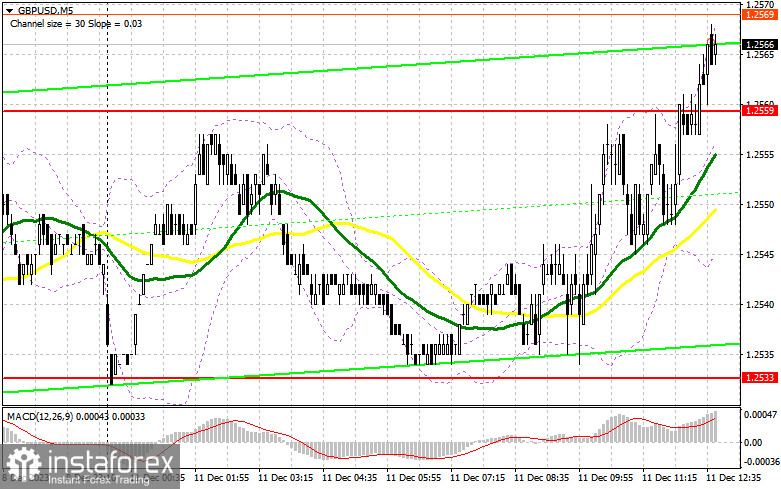
In my morning forecast, I drew attention to the level of 1.2533 and recommended making decisions on market entry based on it. Let's take a look at the 5-minute chart and analyze what happened there. A decline occurred, but we never reached the test of 1.2533, so I didn't wait for entry signals. Considering the low market volatility, the technical picture has not been revised for the second half of the day.

This image is no longer relevant

To open long positions on GBP/USD, the following is required:

Low trading volume and the absence of statistics prevented pound sellers from achieving the development of Friday's scenario. Given that there are no significant statistics for the second half of the day, including in the U.S., one can expect the pound's continued growth. However, before buying near the local maximum, it would be more interesting to wait for a decline and the formation of a false breakout around 1.2533. Only this will provide an entry point into long positions to recover GBP/USD and update the area of 1.2559, formed at the end of last Friday. There, the moving averages, favoring sellers, are also located. Breaking through and consolidating above this range will lead to the removal of stop orders and a more rapid rise of the pound to around 1.2559. The ultimate target will be the area of 1.2583, where I will take profit. In the scenario of a decline in the pair and the absence of bullish activity at 1.2533 in the second half of the day, nothing terrible will happen for buyers. In such a case, only a false breakout around the next support level of 1.2506, acting as the lower boundary of the sideways channel, will signal the opening of long positions. I plan to buy GBP/USD immediately on the rebound only from 1.2478 with the target of a 30-35 point correction within the day.

To open short positions on GBP/USD, the following is required:

Sellers show relatively little activity for now and are unlikely to offer anything around 1.2561 in the second half of the day. Only the formation of a false breakout there, where the moving averages are located, will provide a sell signal and a chance for another downward movement to the intermediate support of 1.2533. Only a breakthrough and a reverse test from the bottom to the top of this range in the absence of significant statistics will deal a more serious blow to the positions of bulls, leading to the removal of stop orders and opening the way to the lower boundary of the channel at 1.2506. A more distant target will be the area of 1.2478, where I will take profit. In the scenario of an increase in GBP/USD and the absence of activity at 1.2559 in the second half of the day, everything is leading to this, I will postpone sales until a false breakout at the level of 1.2583. In the absence of downward movement even there, I will sell GBP/USD immediately on the rebound from 1.2609, but only in anticipation of a pair correction down by 30-35 points within the day.

This image is no longer relevant

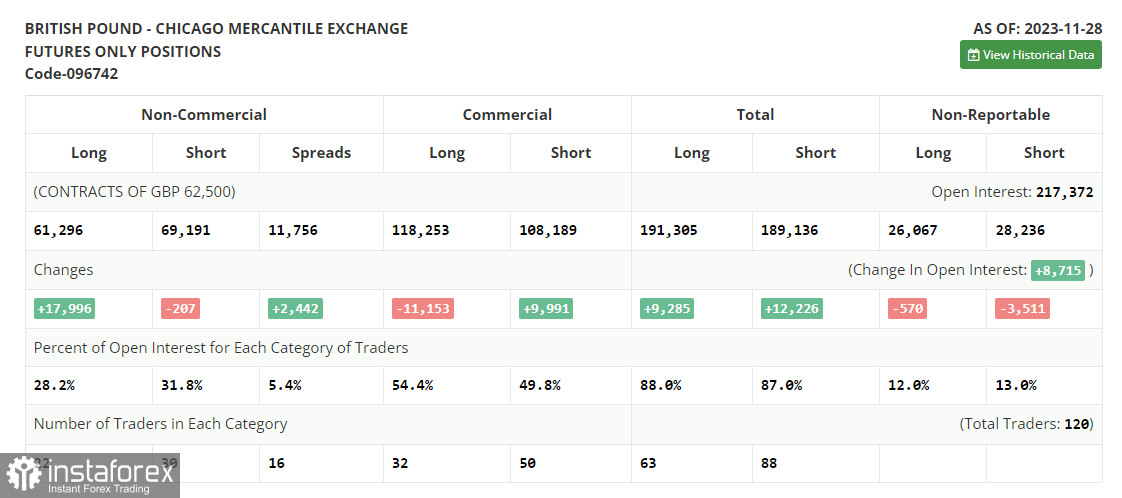
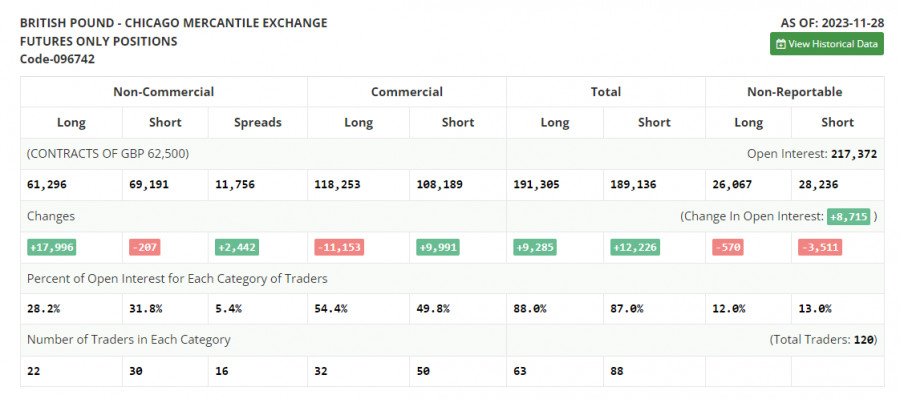
In the COT report (Commitment of Traders) for November 28, there was a sharp increase in long positions and a slight reduction in shorts. Demand for the pound persists, as statements by the Bank of England Governor Andrew Bailey that the regulator, if not continuing to raise interest rates, will at least maintain them at current highs for a fairly long period to help attract new buyers to the market. Add to this the dovish rhetoric of Federal Reserve representatives, together with its chairman Jerome Powell, and it becomes clear why the pound may continue to rise soon. Important statistics on the U.S. labor market will be released soon, which will clarify everything. In the latest COT report, it is stated that non-commercial long positions increased by 17,996 to the level of 61,296, while non-commercial short positions fell by 207 to the level of 69,191. As a result, the spread between long and short positions increased by 2,442. The weekly closing price rose and amounted to 1.2701 against 1.2543.

This image is no longer relevant

Indicator Signals:

Moving Averages

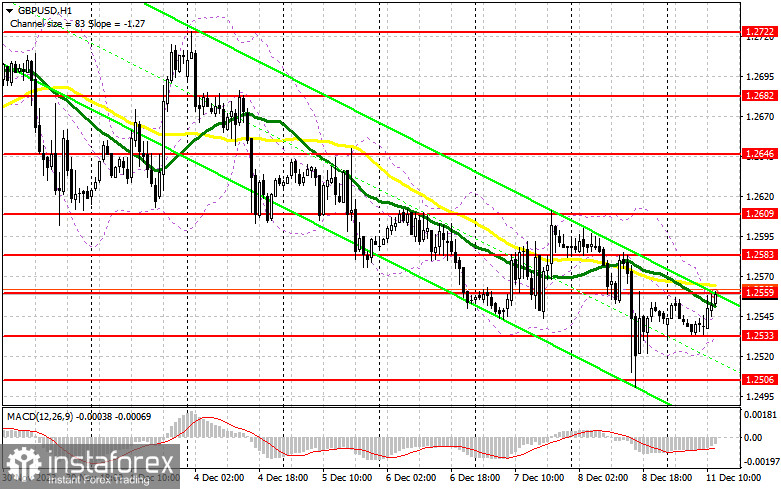
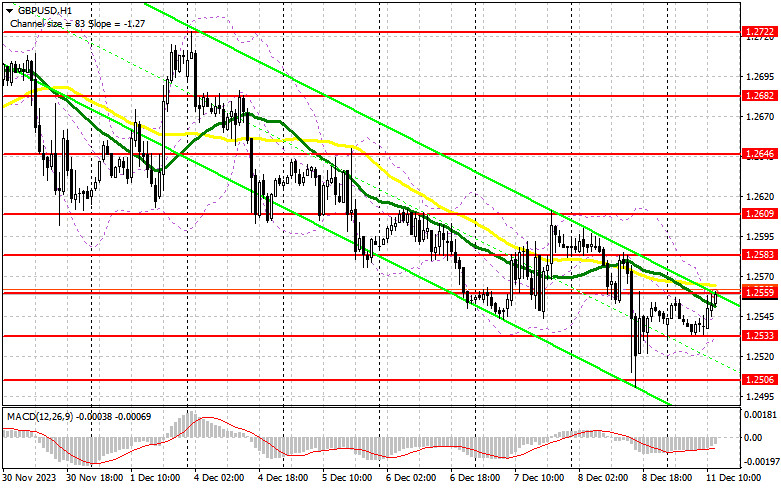
Trading is carried out around the 30 and 50-day moving averages, indicating a sideways market.

Note: The author considers the period and prices of moving averages on the hourly chart H1, which differs from the general definition of classical daily moving averages on the daily chart D1.

Bollinger Bands

In the case of a decline, the lower boundary of the indicator around 1.2535 will act as support.

Description of Indicators

  • Moving average (determines the current trend by smoothing volatility and noise). Period 50. Marked on the chart in yellow.
  • Moving average (determines the current trend by smoothing volatility and noise). Period 30. Marked on the chart in green.
  • MACD indicator (Moving Average Convergence/Divergence). Fast EMA period 12. Slow EMA period 26. SMA period 9
  • Bollinger Bands. Period 20
  • Non-commercial traders - speculators, such as individual traders, hedge funds, and large institutions, use the futures market for speculative purposes and to meet certain requirements.
  • Long non-commercial positions represent the total long open position of non-commercial traders.
  • Short non-commercial positions represent the total short open positions of non-commercial traders.
  • The total non-commercial net position is the difference between the short and long positions of non-commercial traders.
GBPUSD
Great Britain Pound vs US Dollar
Summary
Neutral
Urgency
1 day
Analytic
Maxim Magdalinin
Start trade
Gana con los cambios en el valor de las criptomonedas con InstaForex.
Descarga MetaTrader 4 y abre tu primera operación.
  • Grand Choice
    Contest by
    InstaForex
    InstaForex always strives to help you
    fulfill your biggest dreams.
    UNIRSE AL CONCURSO

Recommended Stories

GBP/USD: plan para la sesión europea del 20 de junio. Informes Commitment of Traders COT (análisis de las operaciones de ayer). La libra reaccionó con una subida tras la decisión del Banco de Inglaterra

GBP/USD: plan para la sesión europea del 20 de junio. Informes Commitment of Traders COT (análisis de las operaciones de ayer). La libra reaccionó con una subida tras la decisión

Miroslaw Bawulski 08:49 2025-06-20 UTC+2

EUR/USD: plan para la sesión europea del 20 de junio. Informes Commitment of Traders COT (análisis de las operaciones de ayer). El euro se recuperó bastante bien

Ayer se formó un punto de entrada al mercado. Veamos el gráfico de 5 minutos y analicemos lo que ocurrió allí. En mi pronóstico matutino presté atención al nivel

Miroslaw Bawulski 08:49 2025-06-20 UTC+2

GBP/USD: plan para la sesión europea del 19 de junio. Informes Commitment of Traders COT (análisis de las operaciones de ayer). La libra espera la reunión decisiva del Banco de Inglaterra

GBP/USD: plan para la sesión europea del 19 de junio. Informes Commitment of Traders COT (análisis de las operaciones de ayer). La libra espera la reunión decisiva del Banco

Miroslaw Bawulski 13:23 2025-06-19 UTC+2

EUR/USD: plan para la sesión europea del 19 de junio. Informes Commitment of Traders COT (análisis de las operaciones de ayer). El euro fue comprado al acercarse a 1.1445

En mi pronóstico matutino presté atención al nivel de 1.1445 y planeé tomar decisiones de entrada al mercado desde ese punto. Veamos el gráfico de 5 minutos y entendamos

Miroslaw Bawulski 13:23 2025-06-19 UTC+2

GBP/USD: plan para la sesión europea del 17 de junio. Informes Commitment of Traders COT (análisis de las operaciones de ayer). La libra mantiene posibilidades de crecimiento

Ayer solo se formó un punto de entrada al mercado. Veamos el gráfico de 5 minutos y analicemos lo que sucedió. En mi pronóstico matutino presté atención al nivel

Miroslaw Bawulski 08:31 2025-06-17 UTC+2

EUR/USD: plan para la sesión europea del 17 de junio. Informes Commitment of Traders COT (análisis de las operaciones de ayer). El euro está atrapado en un canal

Ayer solo se formó un punto de entrada al mercado. Propongo echar un vistazo al gráfico de 5 minutos y analizar lo sucedido. En mi pronóstico matutino presté atención

Miroslaw Bawulski 08:31 2025-06-17 UTC+2

GBP/USD: plan para la sesión europea del 13 de junio. Informes Commitment of Traders COT (análisis de las operaciones de ayer). La libra volvió a caer

Ayer se formaron varios excelentes puntos de entrada al mercado. Veamos el gráfico de 5 minutos y analicemos lo que ocurrió. En mi pronóstico matutino presté atención al nivel 1.3536

Miroslaw Bawulski 08:52 2025-06-13 UTC+2

EUR/USD: plan para la sesión europea del 13 de junio. Informes Commitment of Traders COT (análisis de las operaciones de ayer). El euro cayó bruscamente tras los ataques de Israel a Irán.

EUR/USD: plan para la sesión europea del 13 de junio. Informes Commitment of Traders COT (análisis de las operaciones de ayer). El euro cayó bruscamente tras los ataques de Israel

Miroslaw Bawulski 08:52 2025-06-13 UTC+2

GBP/USD: plan para la sesión europea del 9 de junio. Informes COT (análisis de las operaciones de ayer). La libra sigue dentro del rango

El pasado viernes se formaron varios puntos de entrada al mercado. Veamos el gráfico de 5 minutos y analicemos qué ocurrió. En mi pronóstico matutino presté atención al nivel

Miroslaw Bawulski 07:42 2025-06-09 UTC+2

EUR/USD: plan para la sesión europea del 9 de junio. Informes COT (análisis de las operaciones de ayer). El dólar subió tras los datos de desempleo

El pasado viernes solo se formó un punto de entrada al mercado. Veamos el gráfico de 5 minutos y analicemos qué ocurrió allí. En mi pronóstico matutino presté atención

Miroslaw Bawulski 07:42 2025-06-09 UTC+2
¿No puede hablar ahora mismo?
Ingrese su pregunta en el chat.
Widget callback
 

Dear visitor,

Your IP address shows that you are currently located in the USA. If you are a resident of the United States, you are prohibited from using the services of InstaFintech Group including online trading, online transfers, deposit/withdrawal of funds, etc.

If you think you are seeing this message by mistake and your location is not the US, kindly proceed to the website. Otherwise, you must leave the website in order to comply with government restrictions.

Why does your IP address show your location as the USA?

  • - you are using a VPN provided by a hosting company based in the United States;
  • - your IP does not have proper WHOIS records;
  • - an error occurred in the WHOIS geolocation database.

Please confirm whether you are a US resident or not by clicking the relevant button below. If you choose the wrong option, being a US resident, you will not be able to open an account with InstaForex anyway.

We are sorry for any inconvenience caused by this message.