signal strength 3 of 5

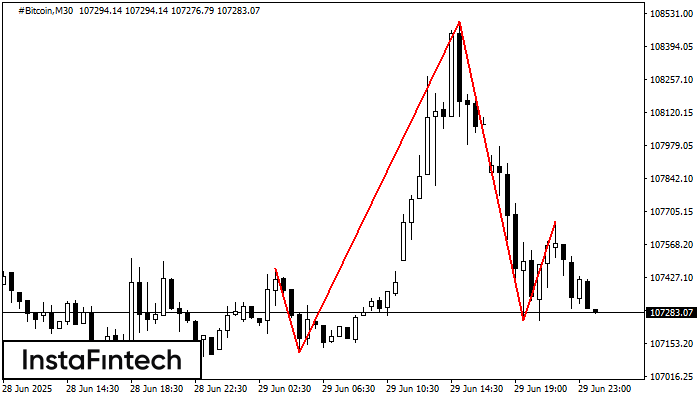
The #Bitcoin M30 formed the Head and Shoulders pattern with the following features: The Head’s top is at 108499.13, the Neckline and the upward angle are at 107112.85/107248.11. The formation of this pattern can bring about changes in the current trend from bullish to bearish. In case the pattern triggers the expected changes, the price of #Bitcoin will go towards 107247.80.
Vea asimismo
- All
- Double Top
- Flag
- Head and Shoulders
- Pennant
- Rectangle
- Triangle
- Triple top
- All
- #AAPL
- #AMZN
- #Bitcoin
- #EBAY
- #FB
- #GOOG
- #INTC
- #KO
- #MA
- #MCD
- #MSFT
- #NTDOY
- #PEP
- #TSLA
- #TWTR
- AUDCAD
- AUDCHF
- AUDJPY
- AUDUSD
- EURCAD
- EURCHF
- EURGBP
- EURJPY
- EURNZD
- EURRUB
- EURUSD
- GBPAUD
- GBPCHF
- GBPJPY
- GBPUSD
- GOLD
- NZDCAD
- NZDCHF
- NZDJPY
- NZDUSD
- SILVER
- USDCAD
- USDCHF
- USDJPY
- USDRUB
- All
- M5
- M15
- M30
- H1
- D1
- All
- Buy
- Sale
- All
- 1
- 2
- 3
- 4
- 5
Según el gráfico de M30, NZDJPY formó el Rectángulo Alcista que es un patrón de la continuación de una tendencia. El patrón está contenido dentro de los siguientes límites
Open chart in a new windowSegún el gráfico de M15, el GBPJPY formó el patrón Triángulo Simétrico Alcista. El límite inferior del patrón toca las coordenadas 198.75/199.07 donde el límite superior cruza 199.49/199.07
Los marcos de tiempo M5 y M15 pueden tener más puntos de entrada falsos.
Open chart in a new windowEl patrón Doble Piso ha sido formado en AUDCHF M30; el límite superior es 0.5225; el límite inferior es 0.5215. El ancho del patrón es 9 puntos. En caso
Open chart in a new window