empty
сформирован 30.06 в 01:10:33 (UTC+0)
сила сигнала 1 из 5
Бычий флаг NZDUSD M5

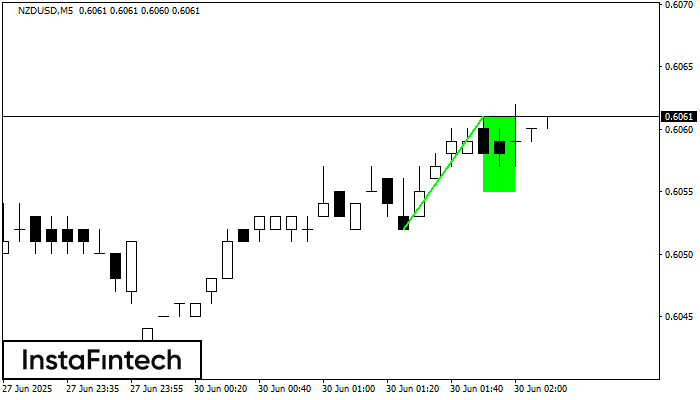
По NZDUSD на M5 сформировалась фигура «Бычий флаг». Нижняя граница фигуры имеет координаты 0.6055/0.6055, при этом верхняя граница 0.6061/0.6061. Проекция высоты флагштока 9 пунктов. Формирование фигуры «Бычий флаг» наиболее вероятным образом свидетельствует о продолжении восходящего тренда. Это означает, что, в случае пробоя значения 0.6061, курс, вероятнее всего, продолжит движение вверх.

Таймфреймы М5 и М15 могут иметь больше ложных точек входа.

Shuningdek ko'ring

Фигура
  • Все
  • Вымпел
  • Голова и плечи
  • Двойная вершина
  • Прямоугольник
  • Треугольник
  • Тройная вершина
  • Флаг
Инструмент
  • Все
  • #AAPL
  • #AMZN
  • #Bitcoin
  • #EBAY
  • #FB
  • #GOOG
  • #INTC
  • #KO
  • #MA
  • #MCD
  • #MSFT
  • #NTDOY
  • #PEP
  • #TSLA
  • #TWTR
  • AUDCAD
  • AUDCHF
  • AUDJPY
  • AUDUSD
  • EURCAD
  • EURCHF
  • EURGBP
  • EURJPY
  • EURNZD
  • EURRUB
  • EURUSD
  • GBPAUD
  • GBPCHF
  • GBPJPY
  • GBPUSD
  • GOLD
  • NZDCAD
  • NZDCHF
  • NZDJPY
  • NZDUSD
  • SILVER
  • USDCAD
  • USDCHF
  • USDJPY
  • USDRUB
Таймфрейм
  • Все
  • M5
  • M15
  • M30
  • H1
  • D1
Тренд
  • Все
  • Покупка
  • Продажа
Сила сигнала
  • Все
  • 1
  • 2
  • 3
  • 4
  • 5
Bullish Rectangle
was formed on 07.10 at 18:33:57 (UTC+0)
signal strength 2 of 5
Bullish Rectangle AUDJPY M15

According to the chart of M15, AUDJPY formed the Bullish Rectangle. The pattern indicates a trend continuation. The upper border is 99.59, the lower border is 99.41. The signal means

The M5 and M15 time frames may have more false entry points.

Open chart in a new window
Bullish Rectangle
was formed on 07.10 at 18:15:59 (UTC+0)
signal strength 1 of 5
Bullish Rectangle AUDJPY M5

According to the chart of M5, AUDJPY formed the Bullish Rectangle. This type of a pattern indicates a trend continuation. It consists of two levels: resistance 99.59 and support 99.41

The M5 and M15 time frames may have more false entry points.

Open chart in a new window
Double Bottom
was formed on 07.10 at 18:15:35 (UTC+0)
signal strength 1 of 5
Double Bottom NZDCAD M5

The Double Bottom pattern has been formed on NZDCAD M5. Characteristics: the support level 0.8092; the resistance level 0.8098; the width of the pattern 6 points. If the resistance level

The M5 and M15 time frames may have more false entry points.

Open chart in a new window
Hozir telefon orqali gaplasha olmaysizmi?
Savolingizni bering chatda.
Qo'ng'iroq uchun qaytish
 

Dear visitor,

Your IP address shows that you are currently located in the USA. If you are a resident of the United States, you are prohibited from using the services of InstaFintech Group including online trading, online transfers, deposit/withdrawal of funds, etc.

If you think you are seeing this message by mistake and your location is not the US, kindly proceed to the website. Otherwise, you must leave the website in order to comply with government restrictions.

Why does your IP address show your location as the USA?

  • - you are using a VPN provided by a hosting company based in the United States;
  • - your IP does not have proper WHOIS records;
  • - an error occurred in the WHOIS geolocation database.

Please confirm whether you are a US resident or not by clicking the relevant button below. If you choose the wrong option, being a US resident, you will not be able to open an account with InstaForex anyway.

We are sorry for any inconvenience caused by this message.