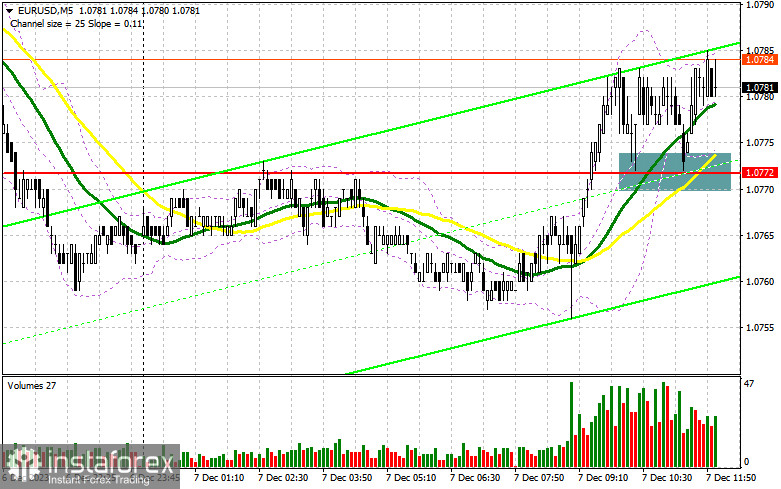
In my morning forecast, I drew attention to the level of 1.0772 and recommended making trading decisions based on it. Let's look at the 5-minute chart and analyze what happened. The breakout and the reverse test of 1.0772 led to a buy signal, but significant growth in continuation of the upward correction did not occur. The technical picture was revised for the second half of the day.
To open long positions on EUR/USD, it is required:
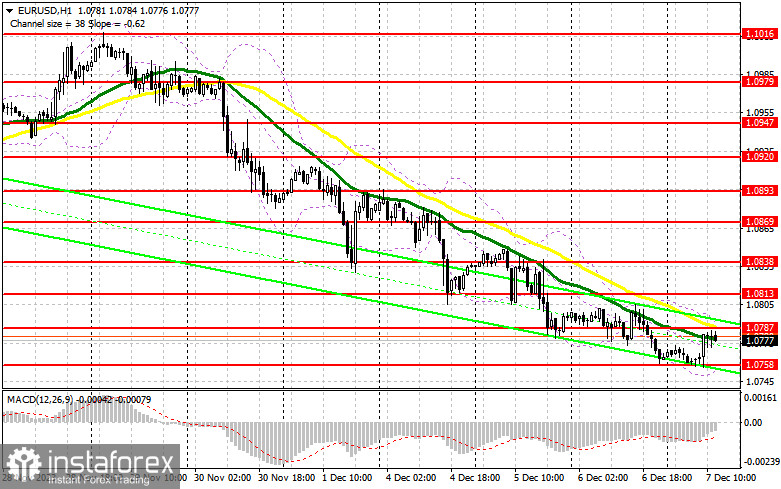
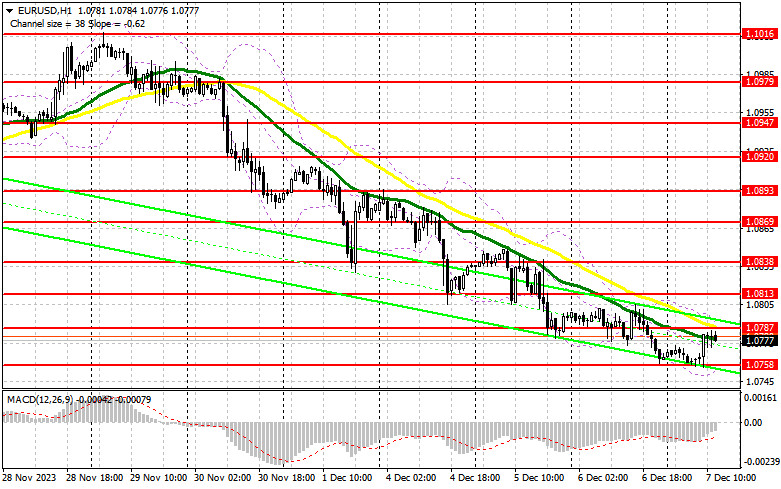
Considering the low volatility and trading volume, the euro will make another attempt to move upward after the US labor market data, which may disappoint. Ahead of us are reports on the number of initial jobless claims and changes in wholesale trade inventories in the US. In the case of strong statistics, I prefer to act on the decline after forming a false breakout around the new weekly low of 1.0758, formed at the end of the first half of the day. The calculation will be for the rise of EUR/USD and testing resistance at 1.0787, where moving averages are located, and I expect a more persistent manifestation of sellers. A breakout and update from top to bottom of 1.0787, similar to what I discussed earlier, and weak reports will surely lead to a new buy signal, preserving the chance for correction and an update to 1.0813. The ultimate target will be the area of 1.0838, where I will take profit. In the case of a decline in EUR/USD, and there are many more prerequisites for this, as well as the absence of activity at 1.0758 in the second half of the day, the downtrend in the pair will continue, creating even more problems for buyers. In this case, I will enter the market only after forming a false breakout around 1.0733 – the new local minimum. I will open long positions immediately on a rebound from 1.0706 with the goal of an upward correction of 30-35 points within the day.
To open short positions on EUR/USD, it is required:
Sellers continue to control the market despite the slight upward correction observed during the European session. The emphasis will now shift to protecting the resistance at 1.0787. The formation of a false breakout after strong labor market data will give an excellent sell signal in anticipation of further euro decline. The nearest target will be the weekly minimum of 1.0758. But only after breaking and consolidating below this range and a reverse test from bottom to top, I expect to get another sell signal with an exit at 1.0733. The ultimate target will be the minimum of 1.0706, where I will take profit. In the case of an upward movement of EUR/USD during the American session and the absence of bears at 1.0787, the upward correction will continue to develop, but this will not significantly harm the bearish market, only paving the way to 1.0813. It is possible to sell there, but only after an unsuccessful consolidation. I will open short positions immediately on a rebound from 1.0838 with the goal of a downward correction of 30-35 points.
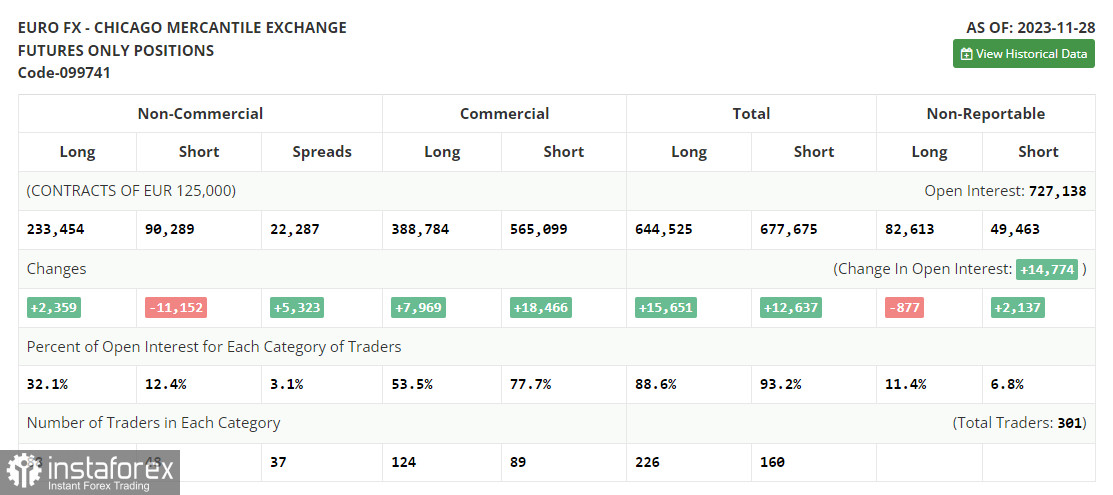
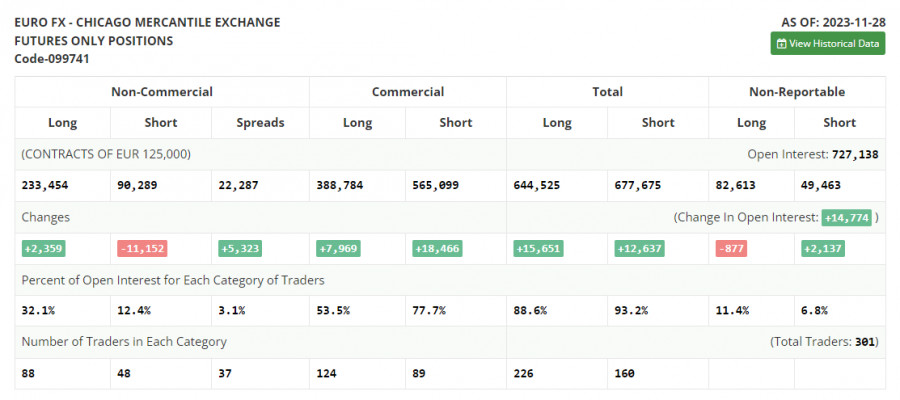
In the COT report (Commitment of Traders) for November 28, there was an increase in long positions and another significant reduction in short positions. The recent statements by representatives of the European Central Bank about high interest rates, even against the backdrop of a rapid reduction in the European economy, currently seem quite absurd, as the market and traders are counting on completely different, softer steps by the ECB next year. Dovish statements by US Federal Reserve representatives also affect the US dollar's positions, which helps the euro grow. A lot of important fundamental statistics related to the US labor market will be released soon, which will help determine the further medium-term direction of the pair. The COT report indicates that non-commercial long positions increased by 2,359 to 233,454, while non-commercial short positions decreased by 11,152 to 90,289. As a result, the spread between long and short positions increased by 5,323. The closing price increased and amounted to 1.1001 against 1.0927.
Indicator Signals:
Moving Averages
Trading is conducted below the 30 and 50-day moving averages, indicating the advantage of sellers.
Note: The author considers the period and prices of moving averages on the hourly chart (H1) and differs from the general definition of classical daily moving averages on the daily chart (D1).
Bollinger Bands
In case of a decrease, the lower boundary of the indicator, around 1.0758, will act as support.
Description of Indicators:
- Moving Average (MA): Defines the current trend by smoothing volatility and noise. Period 50. Marked on the chart in yellow.
- Moving Average (MA): Defines the current trend by smoothing volatility and noise. Period 30. Marked on the chart in green.
- Moving Average Convergence/Divergence (MACD): Fast EMA period 12. Slow EMA period 26. SMA period 9.
- Bollinger Bands: Period 20.
- Non-commercial traders: Speculators such as individual traders, hedge funds, and large institutions use the futures market for speculative purposes and meet certain requirements.
- Non-commercial Long Positions represent the total long open position of non-commercial traders.
- Non-commercial Short Positions represent the total short open position of non-commercial traders.
- The total non-commercial net position is the difference between the short and long positions of non-commercial traders.