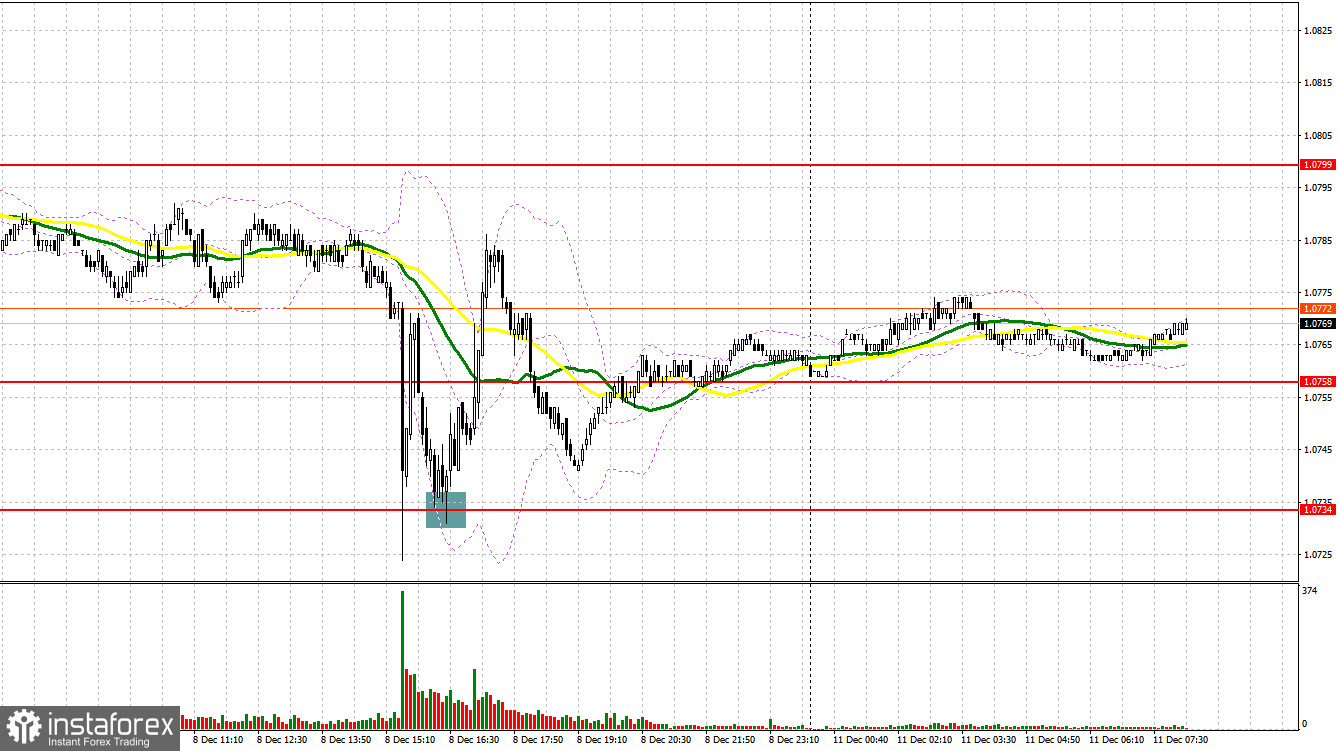
Last Friday, there was only one signal for market entry. Let's have a look at what happened on the 5-minute chart. In my morning review, I mentioned the level of 1.0770 as a possible entry point. The euro fell, but due to the low volatility ahead of the important US reports, the 1.0770 level was not tested. For this reason, we did not get any good entry points. In the afternoon, the euro fell after strong US labor market data. A false breakout at 1.0734 produced a great buy signal, which sent the pair up by more than 50 pips.
For long positions on EUR/USD:
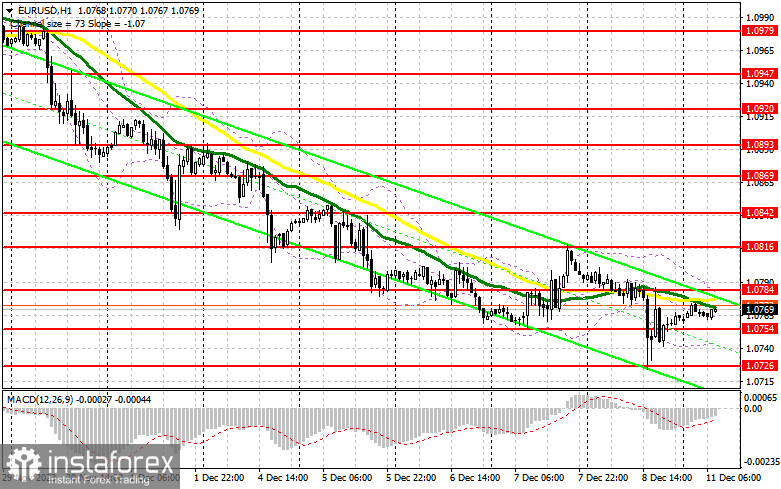
Last Friday, we learned that US job growth accelerated in November, while the unemployment rate fell from 3.9% to 3.7%, which did not match consensus estimates. Markets believe that such reports may convince the Federal Reserve to delay rate cuts in 2024. Therefore, the dollar strengthened and the euro fell at the end of last week and the EURUSD was once again driven by the bearish trend, which was last seen at the end of November. There are no economic reports scheduled for today, so I expect the pair to trade within the sideways channel. In case the pair falls, a false breakout near 1.0754 will generate a buy signal in hopes that the euro will recover after Friday's drawdown and a test of resistance at 1.0784, established on Friday. This is also in line with the bearish moving averages. A breakout and a downward retest of this area will produce a buy signal and a chance to test 1.0816. The highest target will be the area of 1.0842, where I will take profits. In the scenario of a decrease in EUR/USD and the absence of activity at 1.0754 in the first half of the day, the downtrend will persist. In such a case, it will be possible to enter the market after forming a false breakout near 1.0726 - a new local low. I will open long positions immediately on a rebound from 1.0698, bearing in mind an upward correction of 30-35 pips within the day.
For short positions on EUR/USD:
Sellers maintain control of the market, and taking advantage of Friday's data will probably extend the trend at the beginning of the week. To support the downtrend, it is necessary to defend 1.0784. Forming a false breakout at this level will generate a sell signal with the nearest target at 1.0754 - the middle of the sideways channel. Only after a breakout and consolidation below this range, as well as an upward retest, do I expect another sell signal at 1.0726. The lowest target will be the low of 1.0698, where I will take profits. In case of an upward movement of EUR/USD during the European session, as well as the absence of the bears at 1.0784, which is unlikely, the bulls will try to stop the bear market and regain equilibrium. This will open the way for the pair to reach 1.0816. There, selling is also possible but only after a failed consolidation. I will open short positions immediately on a rebound from 1.0842 aiming for a downward correction of 30-35 pips.
COT report:
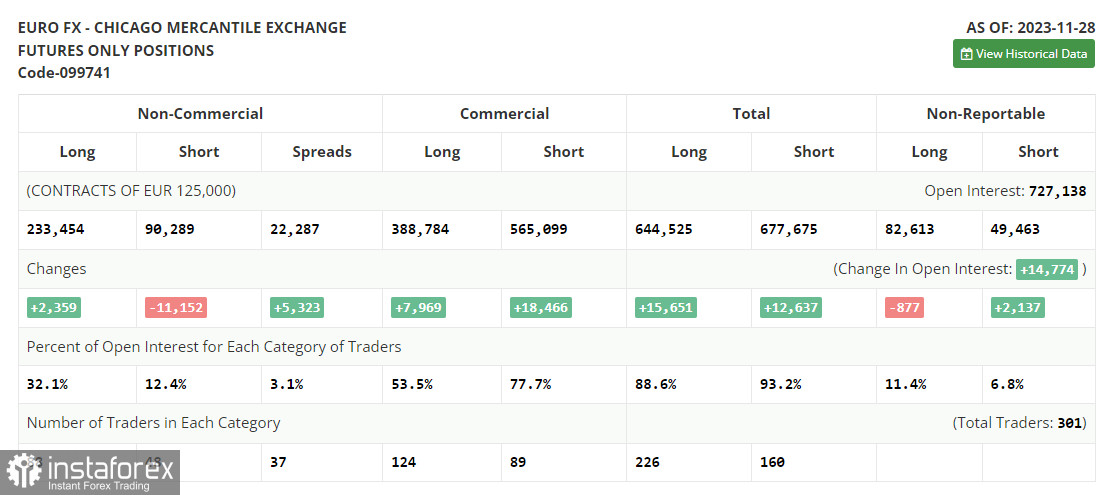
In the COT report (Commitment of Traders) for November 28, there was an increase in long positions and another significant decline in short positions. Obviously, it appears absurd for ECB policy makers to make statements regarding high interest rates while the eurozone economy sees a contraction, and both the market and traders are laying on quite different, softer steps on the part of the central bank next year. Dovish statements of the Federal Reserve officials also affect the USD's positions, which boosts the euro. This week, the US will release a lot of important reports related to the US labor market, which will help determine the pair's direction in the medium-term. The COT report indicated that long non-commercial positions grew by 2,359 to 233,454, while short non-commercial positions decreased by 11,152 to 90,289. As a result, the spread between long and short positions increased by 5,323. EUR/USD closed higher at 1.1001 compared to 1.0927.
Indicator signals:
Moving averages:
Trading just around the 30- and 50-day moving averages indicates sideways movement.
Please note that the time period and levels of the moving averages are analyzed only for the H1 chart, which differs from the general definition of the classic daily moving averages on the D1 chart.
Bollinger Bands
If EUR/USD declines, the indicator's lower border near 1.0740 will serve as support.
Description of indicators:
• A moving average of a 50-day period determines the current trend by smoothing volatility and noise; marked in yellow on the chart;
• A moving average of a 30-day period determines the current trend by smoothing volatility and noise; marked in green on the chart;
• MACD Indicator (Moving Average Convergence/Divergence) Fast EMA with a 12-day period; Slow EMA with a 26-day period. SMA with a 9-day period;
• Bollinger Bands: 20-day period;
• Non-commercial traders are speculators such as individual traders, hedge funds, and large institutions who use the futures market for speculative purposes and meet certain requirements;
• Long non-commercial positions represent the total number of long positions opened by non-commercial traders;
• Short non-commercial positions represent the total number of short positions opened by non-commercial traders;
• The non-commercial net position is the difference between short and long positions of non-commercial traders.