Deal Analysis for Friday:
1H Chart for EUR/USD
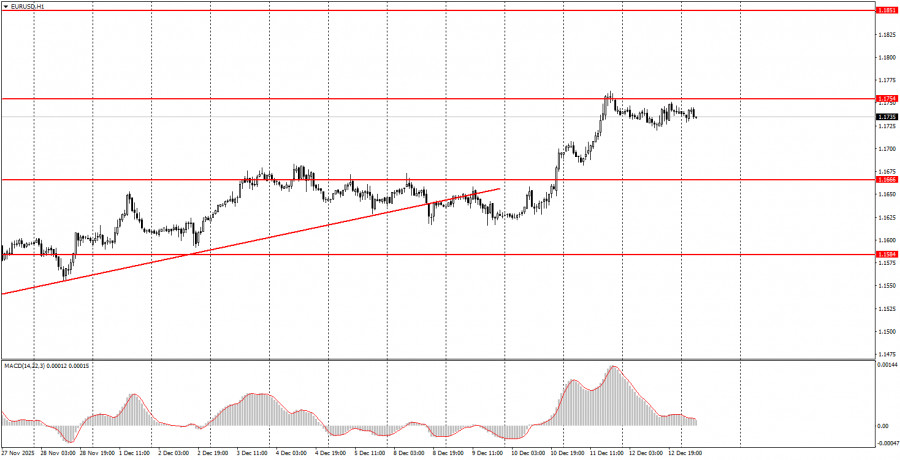
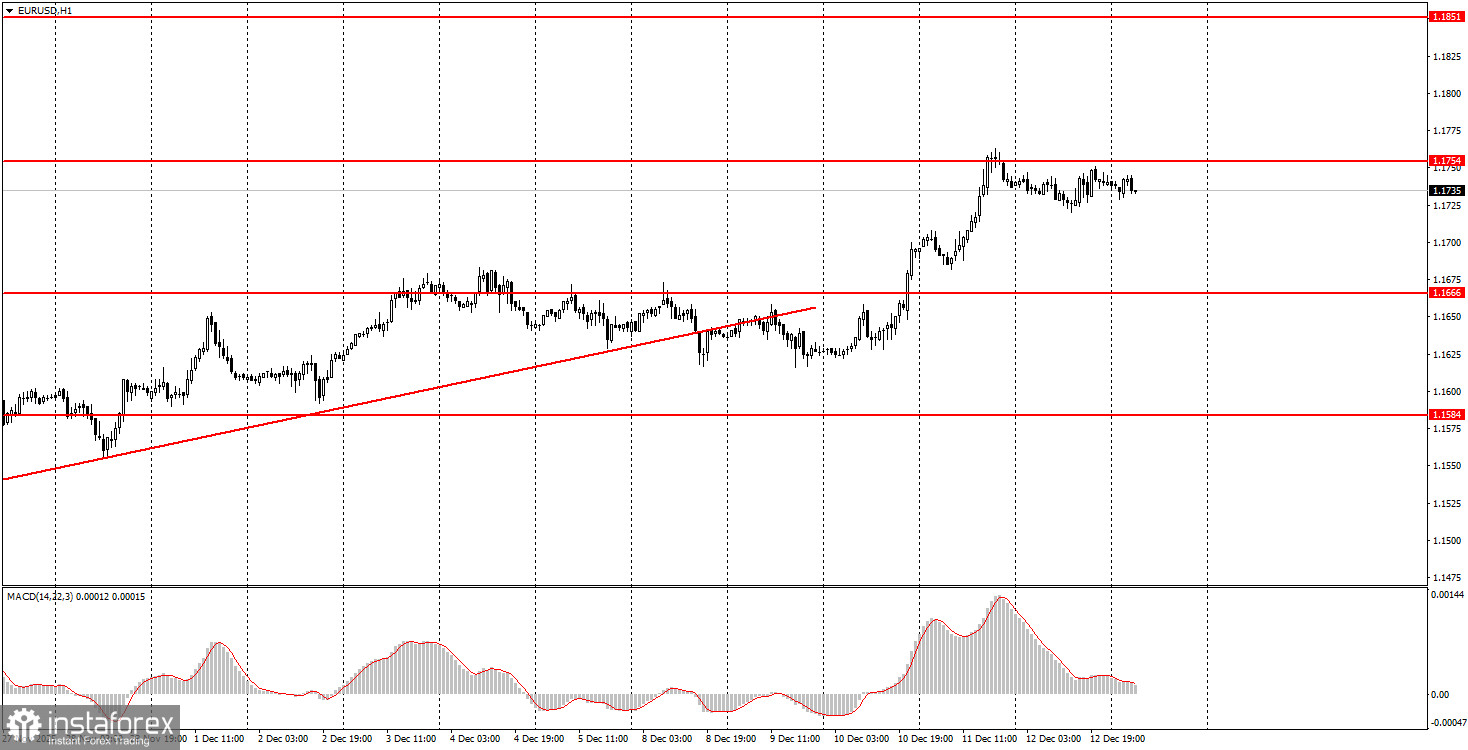
The EUR/USD currency pair traded with minimal volatility and exclusively sideways on Friday. This market behavior is not surprising, as we see a prolonged upward trend on the hourly timeframe, while the daily timeframe remains in a flat range. Consequently, movements in general remain weak. Last week, on Wednesday and Thursday, we witnessed a notable rise in the pair, which was driven by significant events such as the FOMC meeting and its subsequent implications. During those two days, volatility inevitably increased. However, on Friday, we observed a return to the previous state. Once again, there were no movements in the market. This week, there will be many important macroeconomic events, so volatility may rise again. However, for traders, technical factors should currently take precedence – the same flat trend remains in effect. If the price fails to break above the 1.1800-1.1830 range (the upper line of the sideways channel), the flat will persist, and we will see a decline back to the lower boundary over the next few weeks.
5M Chart for EUR/USD
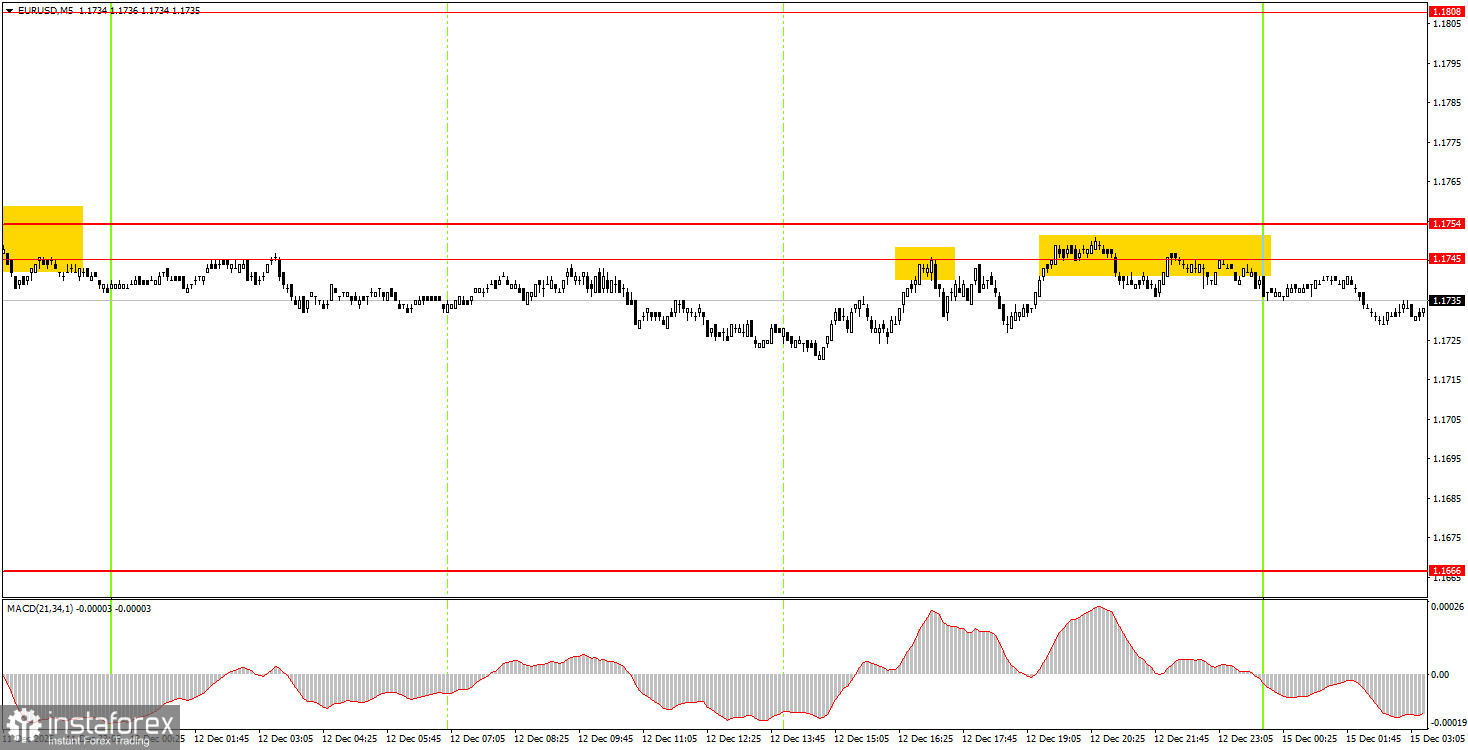
On the 5-minute timeframe, two trading signals were formed on Friday. The pair bounced twice from the area of 1.1745-1.1754, but it did so in the afternoon when it was already 100% clear that there would be no significant movements. Additionally, opening positions in full flat conditions just a few hours before the market closes for the weekend is not the best idea.
How to Trade on Monday:
On the hourly timeframe, the EUR/USD pair continues its upward trend formation, even after it breached the trendline last week. The overall fundamental and macroeconomic backdrop remains very weak for the US dollar, so we expect further growth. Even technical factors currently support the euro currency, as the flat trend on the daily timeframe persists, and a rebound from the lower boundary would reasonably suggest growth toward the higher boundary.
On Monday, beginner traders can trade from the area of 1.1745-1.1754. The two bounces from this area allow for opening short positions with a target of 1.1655-1.1666. If the price consolidates above this area, long positions can be taken with a target of 1.1808.
On the 5-minute timeframe, traders should consider the following levels: 1.1354-1.1363, 1.1413, 1.1455-1.1474, 1.1527-1.1531, 1.1550, 1.1584-1.1591, 1.1655-1.1666, 1.1745-1.1754, 1.1808, 1.1851, 1.1908, 1.1970-1.1988. Only one report is scheduled for Monday—the Eurozone industrial production report. Therefore, it is unlikely that volatility will be higher today.
Key Rules of the Trading System:
- The strength of a signal is determined by the time it takes to form the signal (bounce or breakout). The less time required, the stronger the signal.
- If two or more trades were opened near any level based on false signals, all subsequent signals from that level should be ignored.
- In a flat, any pair may form numerous false signals or none at all. At the first signs of a flat, it is better to stop trading.
- Trades are opened during the period between the beginning of the European session and the middle of the American session, after which all trades should be closed manually.
- On the hourly timeframe, it is preferred to trade only when there is good volatility and a trend confirmed by the trend line or channel, using signals from the MACD indicator.
- If two levels are too close to each other (5 to 20 pips), they should be viewed as a support or resistance area.
- Upon moving 15 pips in the right direction, set the Stop Loss to breakeven.
Chart Explanations:
- Support and Resistance Levels: Levels that serve as targets for opening buys or sells. Take Profit levels can be placed near them.
- Red Lines: Channels or trend lines that reflect the current trend and indicate the preferred direction for trading.
- MACD Indicator (14, 22, 3): A histogram and signal line; a supplementary indicator that can also be used as a source of signals.
Important Note: Significant speeches and reports (always included in the news calendar) can greatly influence the movement of the currency pair. Therefore, during their release, it is advisable to trade cautiously or exit the market to avoid sharp reversals against the preceding movement.
Remember: For beginners trading in the Forex market, it is important to understand that not every trade can be profitable. Developing a clear strategy and practicing money management are keys to long-term trading success.