empty
29.04.2025 04:32 AM
Trading Recommendations and Analysis for EUR/USD on April 29: Euro Growth Did Not Affect the Flat Trend

EUR/USD 5-Minute Analysis

This image is no longer relevant

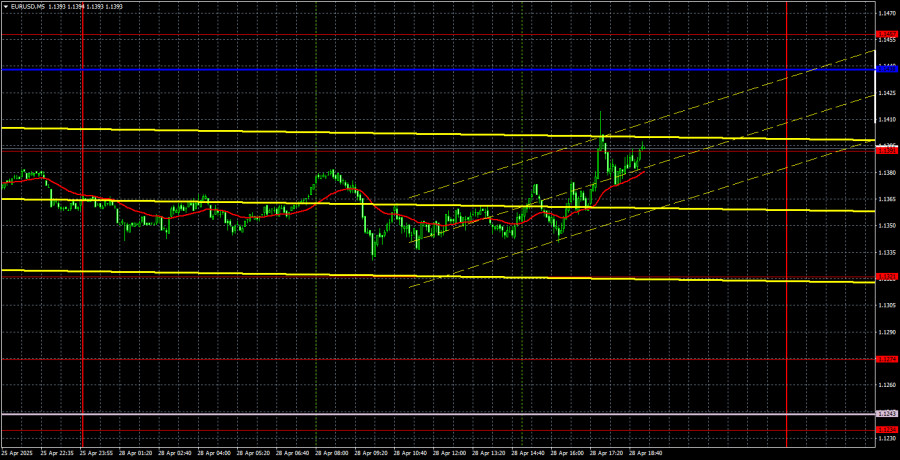
On Monday, the EUR/USD currency pair showed a decent upward movement during the day but remained within the narrow sideways channel of 1.1312–1.1414 (Kijun-sen line). Recall that the euro has been trading between 1.1274 and 1.1457 for three weeks now — a broad sideways channel. As we can see, we've now got a flat within a flat. There were no important statements from the White House on Monday. No significant fundamental or macroeconomic events occurred either. Thus, the growth of the European currency may end quickly and lacks strong justification. What we saw was merely another upswing within the flat range.

A flat market doesn't mean the price is entirely stagnant. On the contrary, it means the price is trading within a limited horizontal range — and within this range, it can rise or fall. The U.S. dollar continues to show no demand in the market, as traders are still waiting for developments in the global trade war. At this point, attention is not on Vietnam or Serbia but on China and the European Union — countries with negotiations that are nonexistent or in very early stages.

There were absolutely no clear trading signals on Monday. Only by evening did the price reach and slightly breach the 1.1391 level, but as became clear 15 minutes later, the breakout was false. The market ignored this technical level — and then ignored it again shortly after. Sometimes, good trading days happen, and sometimes they look like Monday. Traders should remember that the market has far more chaos than logical or consistent movements.

COT Report

This image is no longer relevant

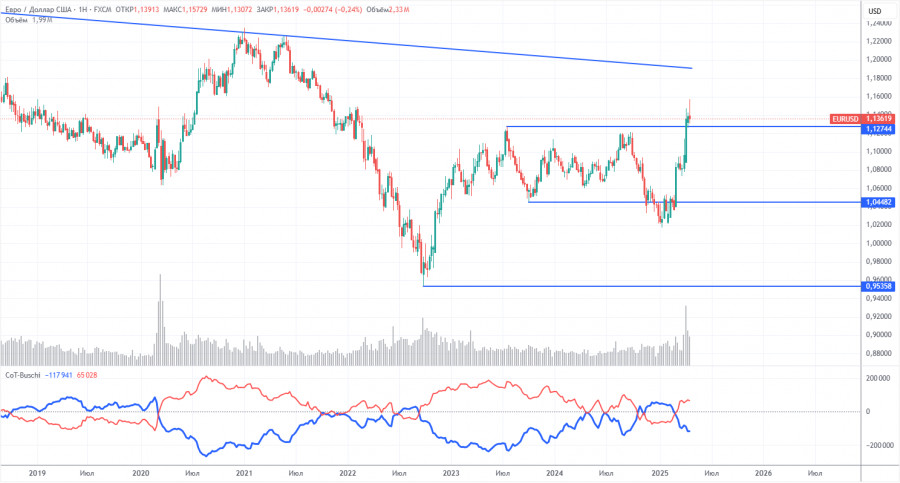
As shown in the chart above, the net position of non-commercial traders remained bullish for a long time. The bears barely managed to move into dominance but quickly lost it. Since Trump took office as U.S. President, the dollar has fallen into an abyss.

We cannot definitively say that the decline of the American currency will continue, and the COT reports reflect the true sentiment of major players, which can also change very quickly in the current circumstances.

We still do not see any fundamental factors for strengthening the European currency, but one very significant factor remains for the fall of the U.S. dollar. The pair may correct for a few more weeks or months, but a 16-year downtrend won't be reversed so quickly.

The red and blue lines have crossed again, so the trend in the market is now bullish once more. Over the last reporting week, the number of longs from the "Non-commercial" group decreased by 900, and the number of shorts increased by 3,300. Accordingly, the net position decreased by 4,200 contracts.

EUR/USD 1-Hour Analysis

This image is no longer relevant

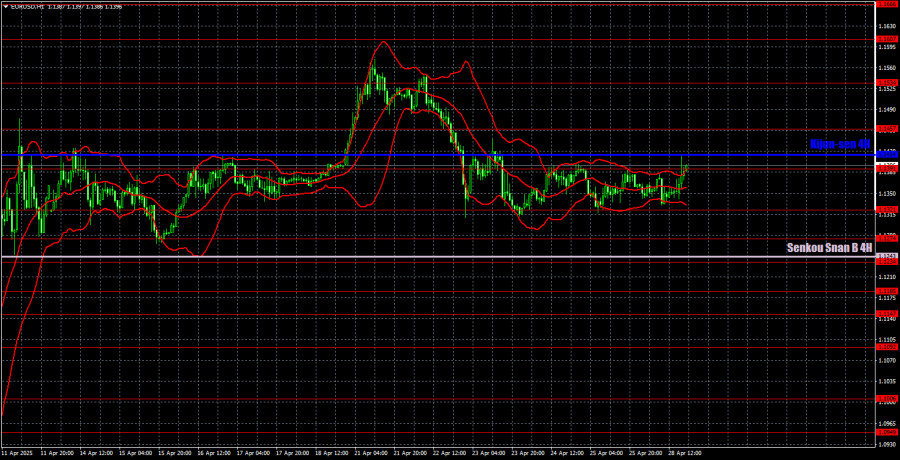
On the hourly timeframe, the EUR/USD pair maintains an upward bias but, over recent weeks, has been trading sideways due to a lack of updates on Trump's trade battles. In the daily timeframe, it is safe to say that the downtrend has been canceled — something that would never have happened if Trump hadn't started a trade war with the world. The fundamental backdrop has disrupted the technical picture — a rare but not unprecedented situation. Currently, price movements have little logic or technical alignment across any timeframe, and macroeconomic data has virtually no effect on the pair's trajectory.

For April 29, we highlight the following trading levels: 1.0823, 1.0886, 1.0949, 1.1006, 1.1092, 1.1147, 1.1185, 1.1234, 1.1274, 1.1321, 1.1391, 1.1474, 1.1607, 1.1666 — along with the Senkou Span B line (1.1243) and the Kijun-sen line (1.1414). The lines of the Ichimoku indicator may shift during the day, which should be considered when identifying trading signals. Don't forget to set your Stop Loss to breakeven once the price moves 15 pips in the correct direction — this helps protect against potential losses if the signal turns out to be false.

No significant events or releases are scheduled in the Eurozone on Tuesday. In the U.S., the JOLTS job openings report for March will be published. It is worth noting that this figure is released with a two-month lag, so the market typically gives more weight to unemployment data or the NonFarm Payrolls report. In any case, this report alone is not strong enough to drastically change market sentiment.

Illustration Explanations:

  • Support and resistance price levels – thick red lines where movement may end. They are not trading signal sources.
  • Kijun-sen and Senkou Span B lines—These are strong Ichimoku indicator lines transferred to the hourly timeframe from the 4-hour one.
  • Extremum levels – thin red lines where the price has previously rebounded. These act as trading signal sources.
  • Yellow lines – trend lines, trend channels, and other technical patterns.
  • COT Indicator 1 on the charts – the size of the net position for each category of traders.
Paolo Greco,
Analytical expert of InstaForex
© 2007-2025
Select timeframe
5
min
15
min
30
min
1
hour
4
hours
1
day
1
week
Earn on cryptocurrency rate changes with InstaForex
Download MetaTrader 4 and open your first trade
  • Grand Choice
    Contest by
    InstaForex
    InstaForex always strives to help you
    fulfill your biggest dreams.
    JOIN CONTEST

Recommended Stories

Trading Recommendations and Analysis for GBP/USD on June 11: The Pound Pauses Before a New Surge

The GBP/USD currency pair continued trading rather chaotically on Tuesday but with a bearish tone. The British pound at least slightly declined after the trend shifted downward. Recall that

Paolo Greco 03:31 2025-06-11 UTC+2

Trading Recommendations and Analysis for EUR/USD on June 11: Flat Movement at Highs

The EUR/USD currency pair continued to move in both directions throughout Tuesday. These movements indicate a flat market. Let us recall that earlier, the pair broke through the ascending trend

Paolo Greco 03:31 2025-06-11 UTC+2

GBP/USD: Trading Plan for the U.S. Session on June 10th (Review of Morning Trades)

In my morning forecast, I drew attention to the 1.3545 level and planned to base market entry decisions on it. Let's look at the 5-minute chart to see what happened

Miroslaw Bawulski 18:26 2025-06-10 UTC+2

EUR/USD: Trading Plan for the U.S. Session on June 10th (Review of Morning Trades)

In my morning forecast, I highlighted the level of 1.1388 and planned to make market entry decisions based on it. Let's take a look at the 5-minute chart

Miroslaw Bawulski 18:22 2025-06-10 UTC+2

How to Trade the GBP/USD Pair on June 10? Simple Tips and Trade Analysis for Beginners

Analysis of Monday's Trades 1H Chart of GBP/USD The GBP/USD pair also traded in both directions on Monday. On Friday, the price consolidated below the ascending trendline, formally changing

Paolo Greco 06:40 2025-06-10 UTC+2

How to Trade the EUR/USD Pair on June 10? Simple Tips and Trade Analysis for Beginners

Analysis of Monday's Trades 1H Chart of EUR/USD The EUR/USD currency pair traded with low volatility and in both directions on Monday. That day, the macroeconomic backdrop was practically absent

Paolo Greco 06:40 2025-06-10 UTC+2

Trading Recommendations and Analysis for GBP/USD on June 10: The Pound Is in No Hurry to Fall Either

On Monday, the GBP/USD currency pair predictably failed to continue its downward movement. Recall that earlier, the price again formed a signal for a trend reversal to bearish—a consolidation below

Paolo Greco 04:11 2025-06-10 UTC+2

Trading Recommendations and Analysis for EUR/USD on June 10: Another Day, Another Dose of Negativity

The EUR/USD currency pair traded mixed throughout Monday. Despite breaking through the trendline, the downward movement (i.e., strengthening the US dollar) never actually began. Thus, technical signals still hold little

Paolo Greco 04:11 2025-06-10 UTC+2

GBP/USD: Trading Plan for the U.S. Session on June 9th (Analysis of Morning Trades)

In my morning forecast, I focused on the 1.3581 level and planned to base entry decisions around it. Let's look at the 5-minute chart and see what happened. The rise

Miroslaw Bawulski 14:16 2025-06-09 UTC+2

EUR/USD: Trading Plan for the U.S. Session on June 9th (Analysis of Morning Trades)

In my morning forecast, I focused on the 1.1430 level and planned to base entry decisions around it. Let's look at the 5-minute chart and see what happened. The pair

Miroslaw Bawulski 14:09 2025-06-09 UTC+2
Can't speak right now?
Ask your question in the chat.
Widget callback
 

Dear visitor,

Your IP address shows that you are currently located in the USA. If you are a resident of the United States, you are prohibited from using the services of InstaFintech Group including online trading, online transfers, deposit/withdrawal of funds, etc.

If you think you are seeing this message by mistake and your location is not the US, kindly proceed to the website. Otherwise, you must leave the website in order to comply with government restrictions.

Why does your IP address show your location as the USA?

  • - you are using a VPN provided by a hosting company based in the United States;
  • - your IP does not have proper WHOIS records;
  • - an error occurred in the WHOIS geolocation database.

Please confirm whether you are a US resident or not by clicking the relevant button below. If you choose the wrong option, being a US resident, you will not be able to open an account with InstaForex anyway.

We are sorry for any inconvenience caused by this message.