The situation in the cryptocurrency market remains unfavorable for traders. Despite a sustained downward trend and no signs of a change toward a bullish scenario, Bitcoin has been rising for almost 3 months now. The nearest "bearish" FVG on Bitcoin's upward path elicited only a very weak market reaction, and the cryptocurrency's current rise cannot be considered strong either. It remains a correction; however, the first significant POI for sales was largely ignored (but the pattern has not yet been canceled). Thus, Bitcoin may now target the second-nearest bearish FVG, within which we will again expect the correction to complete and sell signals to form.
Meanwhile, an increasing number of analysts and indicators are noting the speculative nature of Bitcoin's growth. Once again, it is pointed out that Bitcoin's prices are rising not due to sustained spot demand but rather through futures positions with high leverage. Such trades rarely form a basis for long-term trends; therefore, our stance remains that the downward trend has not concluded. As for spot trades, buying volumes are decreasing. Simply put, investors focused on holding Bitcoin for the long term do not currently believe in a bullish trend and are selling "digital gold" more often than buying it.
Experts also note that the market is far from euphoric. Typically, bullish trends in Bitcoin are accompanied by sharp upward surges and breaches of key levels. In this case, the first cryptocurrency is moving upward at a snail's pace. Over the past three months, daily transaction volumes on the Bitcoin network have decreased by 54%, and the number of transactions is at a five-year low. In our view, major players are either setting a trap for bulls or attempting to "pump" digital gold to spur an upward trend. Nevertheless, we still believe that the "bear season" is not over.
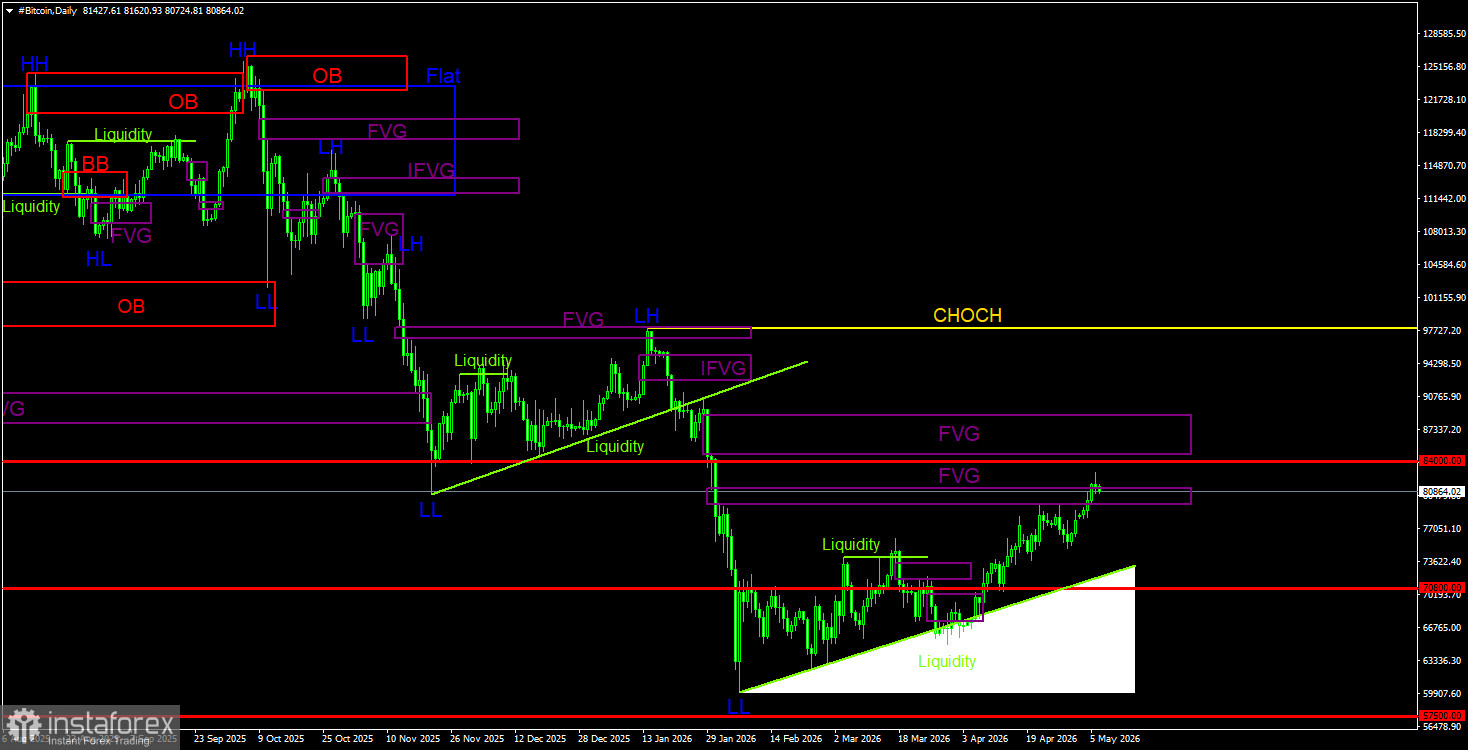
Overall Picture of BTC/USD on 1D
On the daily timeframe, Bitcoin continues to form a downward trend and a correction against it. The trend structure is bearish, and the CHOCH line remains at $97,900. Only above this level can we consider the downward trend to have ended. As there are no signs of a trend reversal toward an upward movement, we believe that a decline will resume sooner or later. On the daily timeframe, the nearest POI for new sell trades is between $79,500 and $81,100. However, this area has been tested twice, and the price reaction was very weak. Consequently, this pattern is likely to be invalidated, and Bitcoin may continue to rise to the next FVG in the $84,900 - $88,800 range. The liquidity pool below the trend line remains a price target. A small "bullish" FVG has also been formed. A reaction to it may signal a continuation of the correction and allow traders to open small long positions.
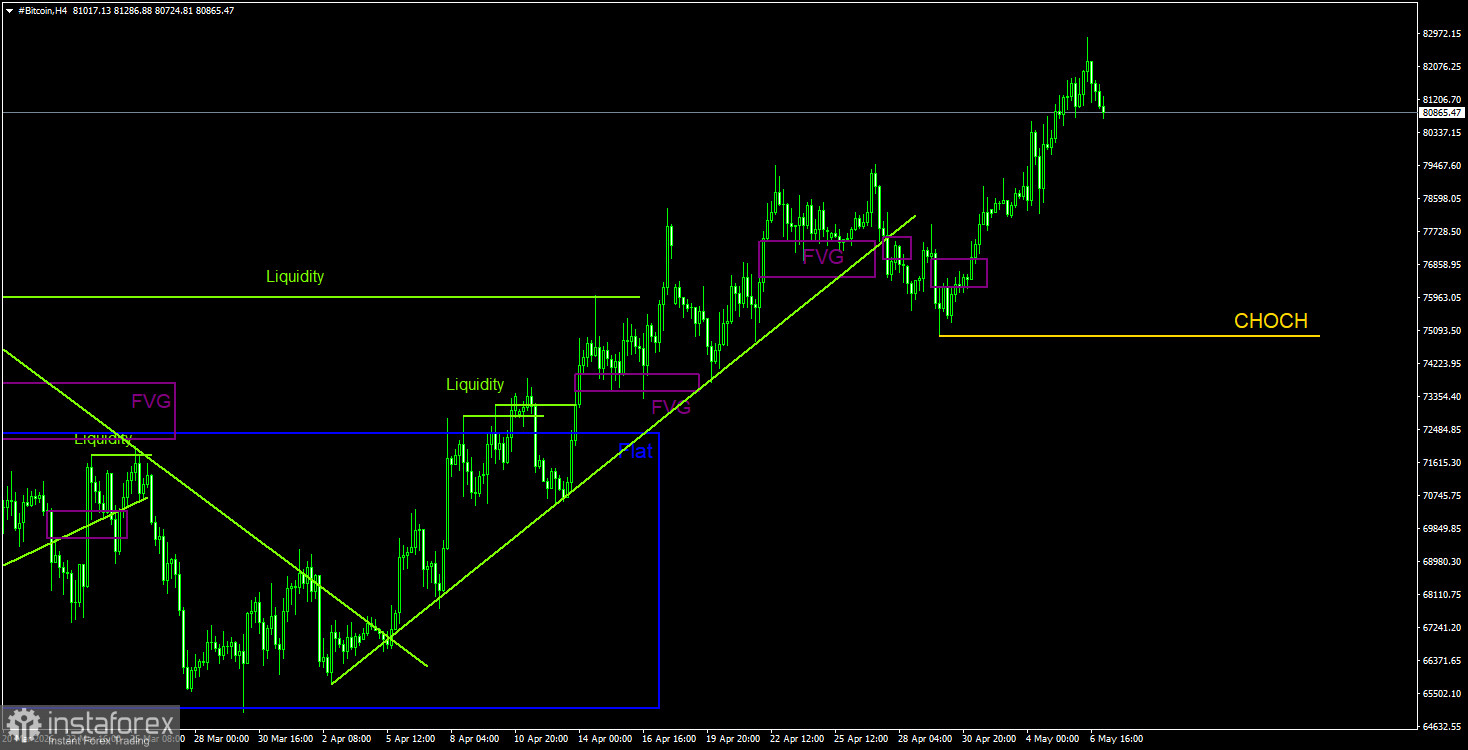
Overall Picture of BTC/USD on 4H
On the 4-hour timeframe, Bitcoin continues its upward movement, which remains a mere correction. The CHOCH line of the current upward structure is now at $74,950; a consolidation below this level will signal a potential trend change. The completion of the upward trend on the 4-hour timeframe may serve as a starting point for a new trend on the daily timeframe. There are still no fundamental grounds for strengthening Bitcoin.
Trading Recommendations for BTC/USD
Bitcoin continues to form a full-fledged downward trend and a correction against it. We continue to expect a decline, targeting $57,500 (the 61.8% Fibonacci level of the three-year upward trend), and there are currently no signs of a trend reversal. Among the POIs at this time, we can only highlight the nearest bearish FVG on the daily timeframe, located in the range of $79,300 - $81,200. It has not been completely invalidated yet, but it may be soon. In this case, the POI for sales will be in the range of $84,900 - $88,800. The targets for decline remain below $60,000. For long positions, the only available bullish FVG can be used, but it should be remembered that the current movement is a correction.
Explanations for the Illustrations:
- CHOCH – Change of the trend structure.
- Liquidity – Stop Loss liquidity from traders that market makers use to build their positions.
- FVG – Fair Value Gap. The price rapidly passes through such areas, indicating a complete absence of one party in the market. Subsequently, the price tends to return and react to those areas.
- IFVG – Inverted Fair Value Gap. After returning to such an area, the price does not react from it; instead, it impulsively breaks through and then tests it from the other side.
- OB – Order Block. The candle on which the market maker opened a position, aiming to capture liquidity and form a position in the opposite direction.